


Should You Add $DPI to Your BTC & ETH Portfolio?
Analysing crypto index products relative to BTC and ETH

This article analyzes common traditional finance (TradFi) performance metrics for DPI and other index products, relative to BTC and ETH. Most crypto investors have allocated a majority of their portfolio to BTC and ETH, with DeFi often representing a more satellite exposure. In that context, it is important to understand the performance and risk consequences of adding selective DeFi exposure to a portfolio.
The time period for this analysis is October 22nd, 2020 to January 31st, 2021 for all products. It’s worth noting that this is a small sample size, so insights drawn should not be considered firm predictors of performance moving forward.
In my original article on this subject, I highlighted some issues with the sDEFI data. Coingecko is missing all historical information between October 7th, 2020 and October 21st, 2020. I wanted to use CoinMarketCap numbers instead, but they didn’t align with the Coingecko data at all. As such, I decided to start the analysis from October 22nd and use Coingecko prices for BTC, ETH and all index products.
I excluded PIPT, as well as DEFI++ from this analysis, given their short performance histories. I will include PIPT in the next update as it will have at least three months of performance history. For the purposes of this analysis, we focus on four products: DPI, sDEFI, DEFI+L and DEFI+S.
Correlation and Beta
First, we take a look at correlations. Correlation simply measures the strength of the relationship between two securities. It can range between -1 and +1. Correlation of +1 means that every time security A goes up, security B goes up with it. Keep in mind that correlation gives us a sense of direction, but tells us little about the magnitude.
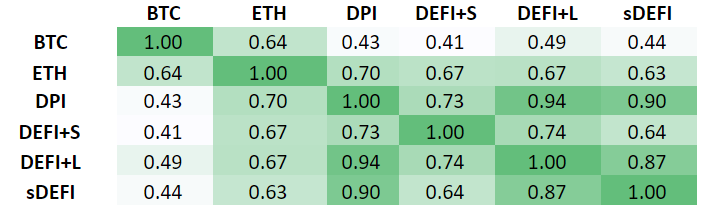
Few notable things here. All four products are somewhat correlated with BTC, with correlations between 0.43 and 0.49. There wasn’t much change on this metric over the last month or so. Their correlation with ETH is more meaningful, between 0.63 and 0.70. Again, not much change over the month of January. Looking at the relationships between the four DeFi index products, we can see that most correlations are above 0.7, suggesting a strong relationship. For example, DPI and DEFI+L and DPI and sDEFI have a correlation of 0.94 and 0.90, respectively. This tells us that they moved virtually in lockstep over the period between October 22nd to January 31st. Correlation between DEFI+L and sDEFI is also strong at 0.87.
As we mentioned before, correlation only gives us a directional idea of how these products move. To get a sense of the magnitude, we need to look at beta. Beta measures the magnitude of the relationship between two products. If Security A has a beta of 1 to security B, it means that each time security B goes up by 1%, security A will go up by 1% as well.
Note to reader: This chart is meant to be consumed horizontally, not vertically. The beta of BTC to ETH will not equal the beta of ETH to BTC.
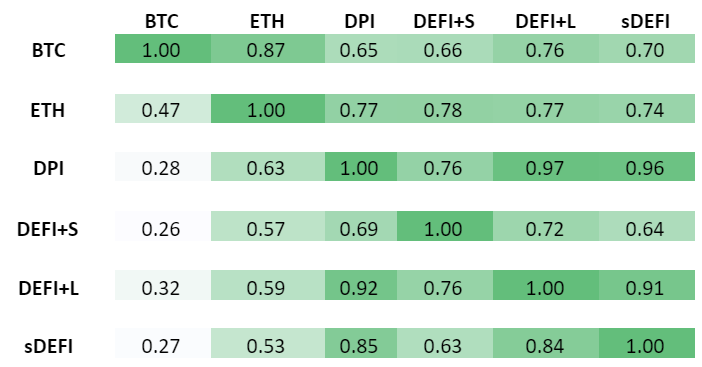
Several observations here. All index products have a higher beta in relation to each other than the majors. To some degree, this speaks to the fact that their performance is driven more by idiosyncratic factors than the market overall. Once again, we can see the very close relationship between DPI, DEFI+L and sDEFI over the period.
Up- and Downside Capture
Another interesting metric that we can use is upside and downside capture against BTC and ETH. Upside capture indicates, on average, how much on Bitcoin’s upside does a token capture, same story on the downside.

Over the last month, we have seen significant changes in the upside and downside capture of DeFi index products. January was a strong period of DeFi outperformance, while BTC experienced a nearly 30% intra-month drawdown and was up just 14% over the month. This led to a meaningful improvement primarily in the downside capture ratios and somewhat more benign changes in upside capture.
Ideally, we want upside capture to exceed downside capture resulting in a positive net number. That’s what we would be looking for from a TradFi asset manager. The last time we looked at the data, in relation to BTC, only DEFI+L satisfied that criteria and DPI was reasonably close to neutral net capture. What a difference one month makes in crypto. At the end of January, all index funds have positive net capture against BTC, with DPI leading the way at 67.5%, followed by sDEFI at 60.5% and DEFI+L at 57.8%.
When it comes to ETH, we see a similar picture but of a different magnitude as ETH delivered a nearly 80% gain in January. Only DEFI+S has a negative net capture ratio against ETH at -16.8%. It’s exciting to see that over the period of this analysis, from October 22nd to January 31st, DeFi index funds are capturing close to 90% of the upside of ETH and only around 65% of the downside. We briefly commented on this being “DeFi season” in our monthly commentary and the fact that DeFi indexes are outperforming both ETH and BTC is certainly supportive of this characterisation.
Standard Deviation
Standard deviation is the primary measurement used for volatility. It measures how widely returns are dispersed from their average. If our returns follow the normal distribution pattern, also known as the Bell Curve, we can expect that 68.2% of the time, daily return will be +1 or -1 standard deviation from its mean. We can see that DPI is the least volatile index product, by a small margin, but the overall volatility of the index products is rather similar.

We can also consider what happens to the volatility if these DEFI index products are held together with either BTC or ETH. Until now, we haven’t seen much portfolio benefit from adding DeFi exposure to BTC and ETH portfolios. The main reason for that was higher volatility in DeFi, without corresponding outperformance. As performance improves, as it did in January, adding DeFi exposure is beginning to make more sense.
For example, it’s interesting to observe that adding 20% DPI exposure to a purely BTC portfolio slightly reduces the risk while increasing returns by circa 10%.
Below are the numbers. 50/50 BTC and 80/20 BTC represent a portfolio with 50% allocation and 80% allocation to BTC, respectively. Same with ETH. 40/40/20 is a 40% BTC, 40% ETH and 20% index fund portfolio. I used daily standard deviation and cumulative returns over the period between October 22nd to January 31st.
DeFi Pulse Index (DPI)

DEFI+S

DEFI+L

sDEFI

Overall, the case for adding DeFi exposure to a concentrated BTC or ETH portfolio is getting somewhat easier to make as we see DeFi outperformance albeit with higher risk. Even for those with 100% BTC allocation, adding DPI or sDEFI over the period, would have reduced the risk while delivering an extra 10% return. Furthermore, investors holding a 50/50 BTC and ETH allocation could consider adding a small DeFi position to their portfolios. However, for those with an entire ETH-based portfolio, adding DeFi has fewer benefits.
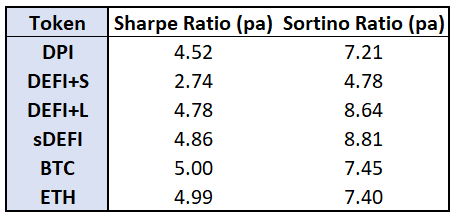
Sharpe Ratio & Sortino
One of our community members, Julien, also analyzed Sharpe and Sortino ratios of DeFi index products. You can see his initial work here. He uses annualized Sharpe & Sortino ratios by taking the average / standard deviation of daily returns and normalizing it for a 365 days period.
The Sharpe ratio is the average return earned in excess of a risk-free rate per unit of volatility or total risk. Volatility is a measure of the price fluctuations of an asset/portfolio and is characterized by the standard deviation of the portfolio’s excess return.
The Sortino ratio is a variation of the Sharpe ratio that differentiates harmful volatility from total overall volatility by using the asset’s standard deviation of negative portfolio returns —i.e. downside deviation only— instead of the total standard deviation of portfolio returns.
This data is for the period between October 25th and January 31st for all funds. Here’s a quick guide to how you can think about these numbers from Julien:
The higher the Sharpe ratio of a portfolio / index, the better the historical return on investment relative to overall volatility — both up and down.
The higher the Sortino ratio of a portfolio / index, the better the historical return on investment relative to overall volatility — only to the downside.
We see that over the given period, BTC and ETH still represent the best risk-adjusted returns. This confirms our takeaways from the standard deviation section above. Outperformance of DeFi in January is noticeable in the Sortino ratios for the DeFi funds like DEFI+L and sDEFI.
We hope that this analysis helps investors think through their portfolio allocations and provides some context for the benefits of DeFi index funds. Historically, owning BTC and ETH was a great portfolio management strategy. However, at this point in the market cycle, we tend to see capital shift further out the risk curve, moving from BTC and ETH into altcoins. Looking at a 3-months period up to the end of January and, even more so in the last few weeks of January, we have seen considerable outperformance of DeFi tokens.

As we see the DeFi space mature, and hopefully outperform over time, adding a dedicated portfolio allocation to DeFi could be a prudent investment decision. DPI is a great way to do so, with transparent methodology, deep liquidity and best-in-class smart contract architecture.
That said, the performance history here is still too short to make meaningful determinations. Please do your own research and consider your personal circumstances when making investment decisions.