


Aave & Compound
A comparison of DeFi's largest lending protocols
Introduction
Aave and Compound are the two largest borrowing and lending protocols in the Ethereum ecosystem measured by Total Value Locked (TVL). At the time of writing, their combined TVL has reached over $15B according to DeFi Pulse. This staggering amount is even more impressive, when compared to one year ago, when Aave’s TVL was ~$30M and Compound was around $90M.
We first introduced the two protocols separately in our introductory series (see here and here). In this piece, we are taking a closer look at the two protocols by lining out some of the differences, in what areas they are similar, and which protocol is under- or overvalued. The remainder of this structure is as follows: We first analyze the user base, we then look at some financial data, and before we conclude, we analyze some decentralization metrics.
Number of Unique User Address Interactions
When comparing the number of users, we can conclude that Compound has an extensive user base relative to Aave (see images below). At the time of writing, Compound had more than 312K unique addresses depositing assets to the protocol. Aave on the other hand reported 47.1K unique addresses using the protocol.
In summary, Compound has over six times the number of wallets accessing its protocol. However, when comparing the two images below, one can’t help but notice that Aave tends to grow its user base more organically and steadily over time, whereas Compound goes through sharp aggressive growth periods.


It is clear that the exponential growth of Compound’s user base can be traced back to incentive schemes. In October 2020, Coinbase launched the Advanced Earn Tasks rewarding users for supplying USDC to Compound, and through completing other tasks, Coinbase customers were enabled to earn a total of $59 in COMP. Through this initiative, 500’000 COMP tokens went to Coinbase customers, which was an important driver to increase Compound’s unique user addresses rapidly. However, although the number of users increased ~6x, plus $UNI and $COMP were added as collateral around the same time, the total value deposited in October 2020 barely moved (as shown in the next chapter). Which indicates that the amounts deposited by the new users were rather small.
Total Value Locked
The Total Value Locked (TVL) in DeFi has exploded, currently around ~$51.23B, and both lending protocols have been big beneficiaries of this trend. In terms of capturing capital inflows, both Compound and Aave have done incredibly well. Compound leads Aave in this area $9.65B to $8.06B. However, it is important to note that TVL does not indicate how much value is being accrued within the protocol, benefiting token holders.


As indicated above, when comparing the total active user address to TVL, there is no obvious correlation to Compound’s huge increase in active user addresses in October 2020. This implies that those new Compound addresses correlated to minimal additional funds being deposited into the protocol. Based on the below chart, Compound appears to be capturing a larger portion of the depositor’s capital into lending protocols.

Token Price vs TVL
In this section, we compare the financials and valuations of the two protocols. The fields highlighted in green mark the “winner” of the respective comparison.
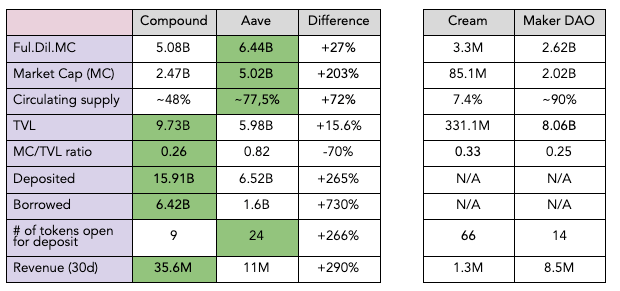
Both protocols report impressive numbers and when looking at the color coding, both protocols are equally well performing. On the other hand, we can also state that the price of COMP is undervalued when directly compared to Aave. First of all, Compound has a much smaller MC/TVL ratio, indicating that the protocol has a high TVL compared to its valuation. Secondly, the amount borrowed (which is where Aave derives its revenue from) is more than four times higher on Compound. Hence, once an income capturing mechanism is put in place for Compound, the expected income will be much higher than Aave’s.
However, as mentioned above, a lot of this competitive edge seems to come from incentivizing users via COMP distribution, as both lenders and borrowers earn COMP tokens. This could be implemented on Aave as well. Ironically, the yield farming schemes that intensified the increase in deposits and loans on Compound, are also partly responsible for the protocol's lower price valuation, because most of these methods earn the COMP token only to sell it right away.
This statement is also supported by the image below. Since the start of November 2020, Aave’s price grew by more than 1,286%, whereas COMP denoted a still impressive but much lower price increase of 426%. Obviously there are many other factors to consider when looking at prices, but the impact of yield farming is certainly playing a part.

A similar picture is shown when looking at the price to sales ratio. This ratio is calculated by dividing a protocol's market capitalization with its annualized revenue. Again Compound has a smaller P/S ratio, indicating that the protocol’s value (or token price) is relatively low for the revenue it generates, when compared with its competitor.

Correlation Coefficient
Correlation coefficient is an indicator of the strength of the linear relationship between two different variables, like BTC and ETH. A linear correlation coefficient that is greater than zero indicates a positive relationship. A value that is less than zero signifies a negative relationship. Finally, a value of zero indicates no relationship between the two variables. Naturally, ETH and BTC show the strongest positive relationship which is to be expected. Let’s take a look at AAVE and COMP and see how they compare.

** Daily Beta values from 5th October to 4th April 2021
Unsurprisingly, both AAVE and COMP have a positive relationship with ETH. This is expected given both are Ethereum protocol based projects. However, AAVE is distinctly uncorrelated with BTC compared to COMP. Surprisingly, even though AAVE and COMP make up 19.64% and 9.55% of DPI, both tokens exhibit a very low correlation with DPI. This implies that both AAVE and COMP tend to follow Ethereum a lot closer than other components within DPI. It is hard to look past the strong diversification benefits of holding DPI, amongst a portfolio of BTC and/or ETH.
Beta Coefficient
A Beta coefficient can measure the volatility of an individual stock compared to the systematic risk of the entire market. Beta is used to help investors understand whether a stock moves in the same direction as the rest of the market. It also provides insights about how volatile, or how risky, a stock is relative to the rest of the market. For Beta to provide any useful insight, the market that is used as a benchmark should be related to the stock.
Beta =1.0, indicates price is perfectly correlated and the price tracks the overall market closely
Beta <1.0, indicated the token’s price is less volatile than the overall market. Adding a token with a Beta 0.8 is assumed to be 20% less volatile than the market and theoretically makes the portfolio less risky
Beta >1.0, indicates a token’s price is more volatile than the market. For example, if a token's Beta is 1.2, it is assumed to be 20% more volatile than the market
Beta = -1.0 means that the token’s price is inversely correlated to the market benchmark. The price moves in the opposite direction to the broader market

** Daily Beta values from 5th October to 4th April 2021
The Beta values above tell an interesting story. The Beta of ETH relative to BTC is positive, and at 0.86, ETH is 14% less volatile than BTC. The same applies to COMP but with a slightly lower Beta of 0.67 relative to BTC. AAVE on the other hand is less affected by BTC’s price movements. This implies that BTC price movements pull ETH and COMP with it. However, the reverse is somewhat true for ETH but not so for COMP, and definitely not for AAVE. COMP captures more of BTC’s moves than AAVE will. In periods when BTC dominance increases, COMP will capture more of the movement than AAVE.
Interestingly, COMP’s Beta relative to AAVE is 0.47 and AAVE’s Beta relative to COMP is 0.66, this implies that AAVE’s price action is a lot more responsive to COMP’s price than what COMP’s price action is of AAVE. Considering AAVE has a stronger correlation with COMP’s price than ETH’s, this implies AAVE’s price is influenced more so by COMP’s and ETH’s. Whereas COMP’s price action is not as affected by AAVE’s. Which makes sense when COMP follows BTC moves more closely than AAVEs. Naturally, what happens with ETH affects both AAVE and COMP in a very similar way, 0.81 and 0.79 Beta values respectively.
60 Day Rolling Beta - ETH, DPI, AAVE & COMP Relative to BTC

The image above shows that over time COMP’s price action over time is capturing a larger portion of BTC moves. AAVE on the other hand diverges from BTC and is a lot more independent with time. This can be interpreted to mean that COMP tracks the market more closely and AAVE tends to forge its own path, driven by information specific to AAVE. A quick review of Medium or Twitter, highlights that news flow from Aave is considerably more frequent than Compounds. Notably, Aave V2 was launched in December of 2020 and soon thereafter AAVE’s Beta relative to BTC started falling away.
Decentralisation
Up to this point we can state that the two protocols are nip and tuck. While Aave is leading in price and some valuation metrics, Compound has a heads start when it comes to TVL, P/S ratio, and user base. In this section, we analyze how well the two protocols do with regards to decentralization.
While for layer one blockchains like Bitcoin and Ethereum, decentralization is required to secure the protocol (prevent 51% attacks), and is measured by the number of miners and notes participating in the network. Decentralization in DeFi on the other hand is first and foremost measured by decision making power (best indicated by distribution of governance token ownership). There are of course other aspects to this, like governance and community engagement, or the technical side of decentralization (e.g. admin key management, data storage, or oracle usage). Both Aave and Compound have transferred their admin keys to the governance module. However, doing a deep dive into all aspects of decentralization would exceed the scope of this article, thus the focus will be on token distribution.
The two protocols are very different in their approach of token distribution. Aave was founded in 2017 and went through an Initial Coin Offering (ICO). During this token sale, Aave (named ETHlend at that time) sold ~75% of its LEND tokens to the public, raising ~$17M in capital. Compound went the more traditional route of a start-up, raising capital from VC’s first. They only introduced the COMP token in early 2020, reserving a little more than 50% for the community and users of the platform (~42% to liquidity providers, 5% to Coinbase Learn and 2.75% to the community reservoir contract).
Before we dive into this more deeply, let us quickly recap and contemplate why decentralization is a good thing. A high distribution of governance tokens should ideally lead to:
Better security of the protocol, i.e. no single point of failure, obviate malicious behavior by single actor or a few coordinated actors
Minimizing trust
Better governance, i.e. democratic decision making (wisdom of the crowd)
Prevent unilateral decision making to profit only a few
The bigger the community, the bigger the support and usage
Can have legal or tax implications (e.g. not a security justification)
Since DeFi is a rather new phenomenon, the data availability and research that can be leveraged for analyzing decentralization is rather thin. However, one metric to compare token ownership is the GINI coefficient. This metric is also used in economics to measure the wealth distribution inequality of a country. It can range from 0 to 1, whereas 1 would imply that only 1 person holds the entire wealth of a country.
In a paper from December 2020, Fabian Schaer and co-writer Matthias Nadler introduced a method to calculate token distribution (incl. GINI coefficient). They used an algorithm for unwrapping token ownership over multiple levels of ecosystem integration (e.g. LPs, deposits, wrapped tokens). This method allows for a much clearer picture of real token distribution. They conclude that for the most popular DeFi protocols, the majority of tokens are held by only a handful of individuals. Below are some of the findings from the paper (data from September 2020).

The table above reflects what Fabian and Matthias criticize about the entire DeFi space, that is a very high concentration of tokens with less than 20 individuals having 50% of the voting rights. As illustrated in the table, the top 50 $COMP holders have 87% of all tokens. This is amplified by an extremely high GINI coefficient for the top 500 token holders of 90% and 80% respectively. In comparison, South Africa is currently the country with the highest wealth inequality in the world, with a GINI coefficient of 63%.
The data used in the study is from September, however, a newer study released by the University of Copenhagen in February 2021 does not portray another picture. In addition to the GINI coefficient, Jensen et al. applied the Nakamoto coefficient (NC), which computes how many individual addresses are required to gain 51% voting power. While they did not include Aave into their study, it doesn’t look good for Compound. With only 9 addresses required to have the majority of votes, Compound has the worst NC of all four protocols analyzed in the study. In comparison, UNI had the best score with an NC of 82.
In consequence, we have to conclude that both protocols are not decentralized at this stage, when we measure decentralization by voting power. However, we have to point out that DAOs are a very new phenomenon and Compound and Aave are pioneers in this space. Further, the study also shows that other token distribution methods are not necessarily better. YFI for instance, which was highly praised for its “fair” token distribution, is still not very decentralized with a GINI of 89% and an NC of 71. Schär and Nadler report a GINI 500 of 57% for YFI. We suppose that the difference comes from only taking the top 500 addresses and the unwrapping algorithm applied by Schär and Nadler.
Aave vs Compound
After reviewing both protocols individually first (see Compound and Aave introduction) and in comparison through this article, it became evident that the liquidity mining program introduced by Compound is the most important factor differentiating the two protocols. Very often, the difference between the two protocols - especially when looking at financial numbers - can be traced back to the “free” distribution of COMP tokens.
Ironically, although the aim of the liquidity mining program is to transfer ownership to the community, Aave is more decentralized than Compound when looking at the GINI coefficient. This is mainly due to the high amount of COMP tokens that were reserved for founders, team, early investors and advisors, leaving only ~42% of the remaining tokens to the “community” via liquidity mining. Aave on the other hand sold its tokens via an ICO in 2017, leading to a much less centralized ownership.
In consequence, we can assume that if Aave introduces a liquidity mining program (as proposed on the forum), a negative impact on Aave’s token price is expected, due to higher token inflation and yield farming plays using the distribution mechanism to maximize yield. At the same time, however, an increase in lending and borrowing volume is expected which - due to higher expected revenues - should have a positive effect on the token price. It remains to be seen which force will impact the token price stronger. Furthermore, since the tokens used for LM would come from the treasury - that is currently an unpredictable source of inflation - having a scheduled LM program would bring predictability to future token distribution of Aave.
Conclusion
Although quite different in many ways, both protocols are very successful in what they do. This was reflected in the first section and is also apparent when looking at the percentage they both represent in the DPI. At the same time, we learned from two studies that both protocols can still improve, when it comes to token distribution and the governance structure.
Furthermore, they both have a rather different roadmap. While Aave is focused on establishing partnerships within the DeFi ecosystem and is working on L2 solutions. Compound will go a different route by creating its own chain to operate on, which will increase its independence and open up new possibilities for offering the protocols services.
To conclude, it will be exciting to follow the developments of the two protocols and we might have to write a follow-up article in due time. Stay tuned.
Aave and Compound currently represent 27.8% of the DeFi Pulse Index ($DPI) portfolio. This article is an extension to our introductory series, where we introduce all protocols represented in the $DPI. Get in touch with your comments and let us know what topics you want us to cover in the future.
Links
Index Coop: https://www.indexcoop.com/
Amazingly well written.
Wow, really insightful article.